Django Analytics
Django Analytics Highlights
-
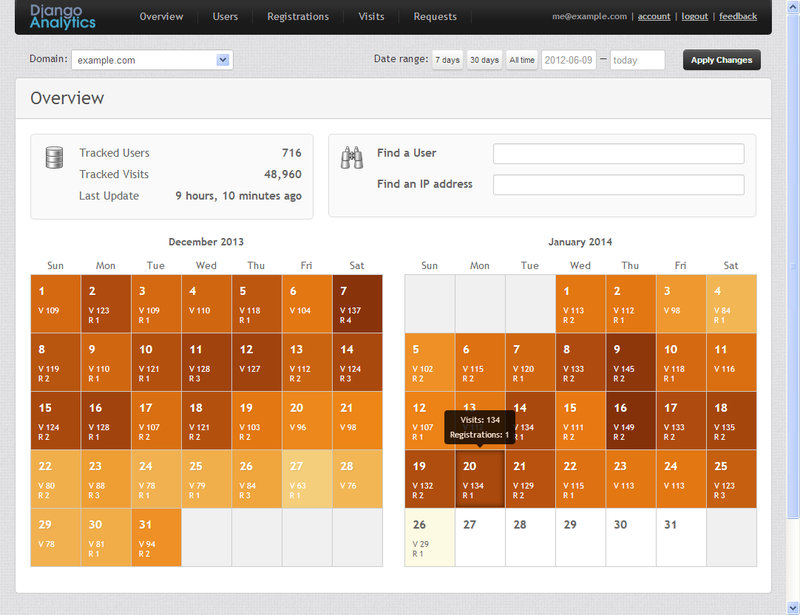
The Dashboard
Your starting point for exploring the collected data. A color-coded calendar shows you registrations, visits and active users per day. Navigate quickly to a specific user or to visits from a specific IP address.
-
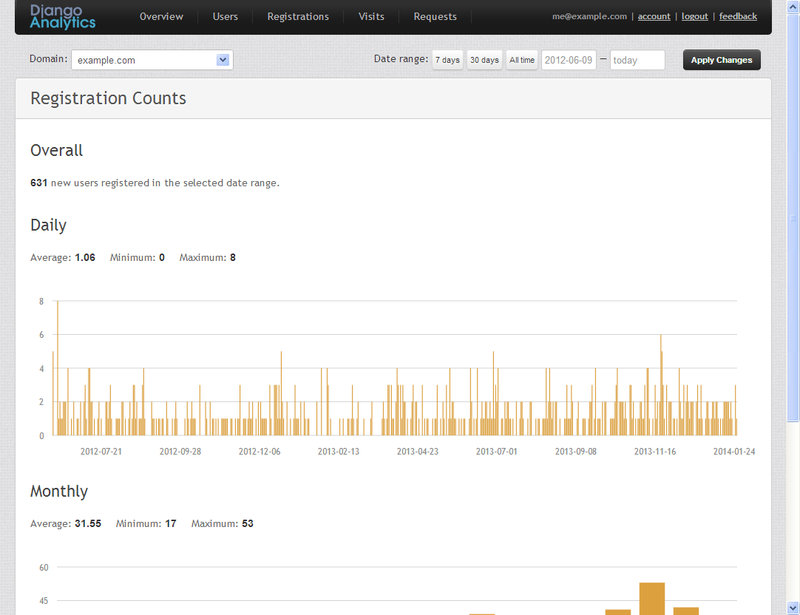
Statistics that Matter
Django Analytics is the easiest way to see daily and monthly registration counts, as well as daily and monthly active users. See how well your site is doing.
-
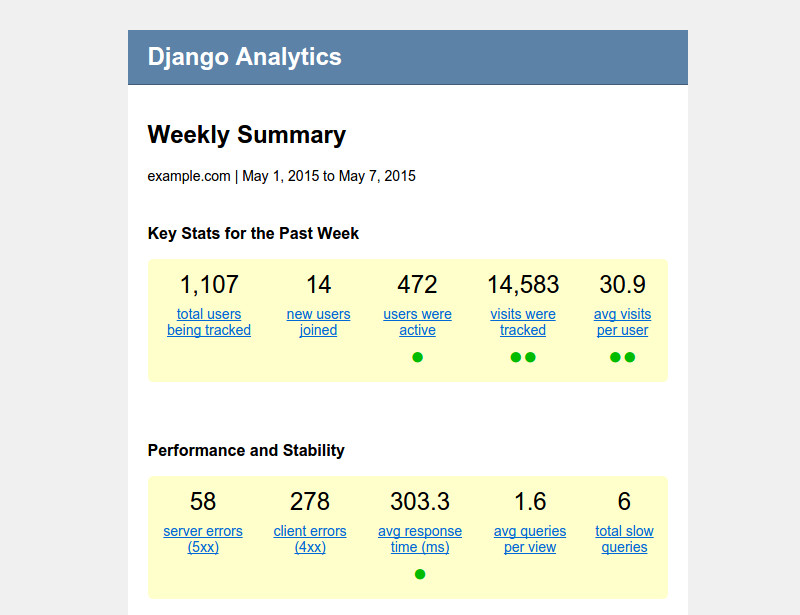
Stay in the Loop
Get a weekly email update containing key performance indicators so you'll always be aware of important changes.
-
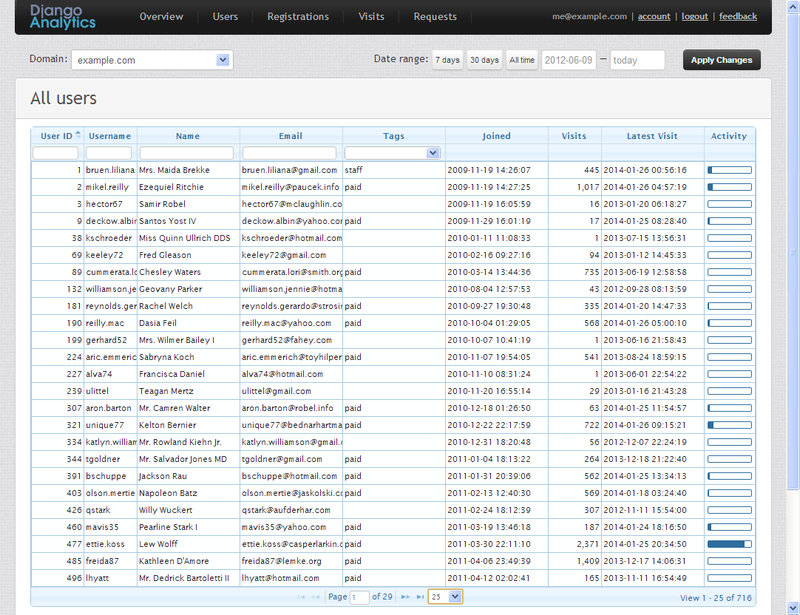
See Every User
Get information about each registered user – when did she join, how many times did she visit your website, and when was the last visit.
Get a feel for the relative activity level of each user, and discover the most faithful ones. Filter by tags that are meaningful to you.
-
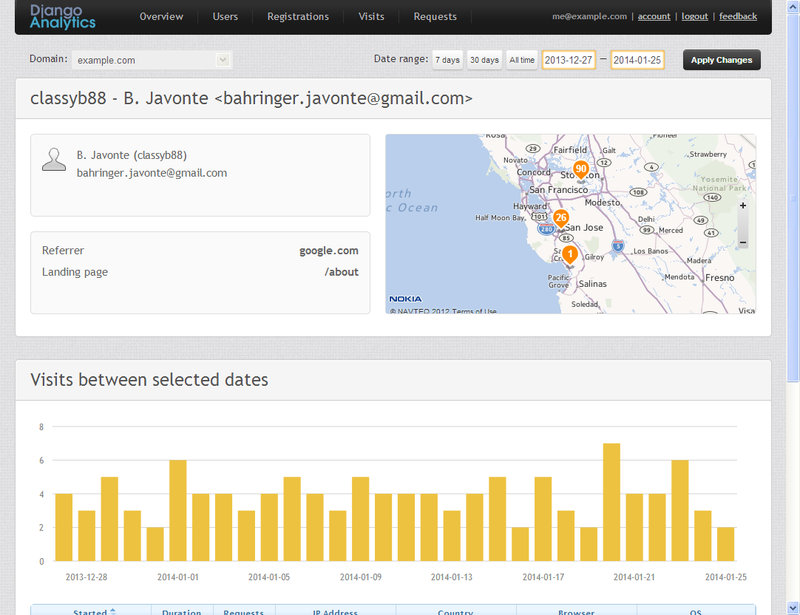
Drill Down to Learn More
Know your users – how they arrived at your website, where are they from, how often do they visit.
Then jump into specific visits, for research or technical support.
-
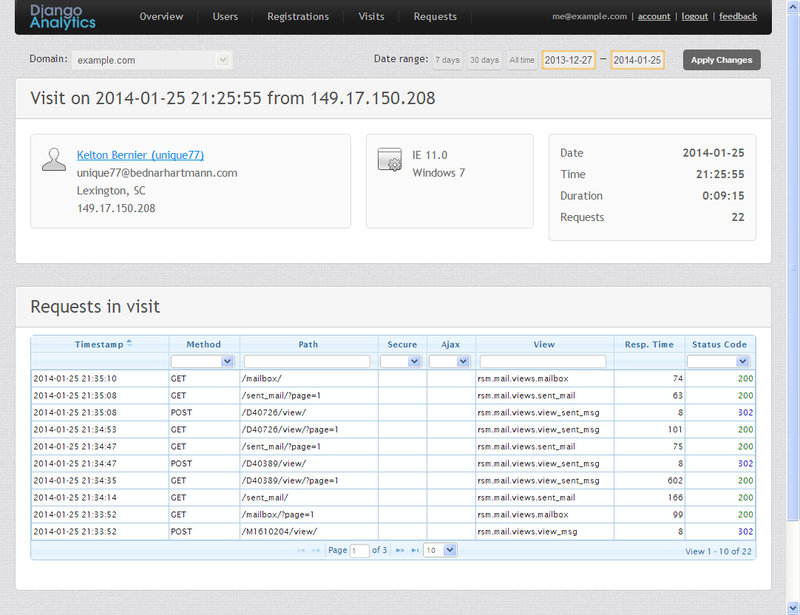
Full Visit Details
See everything that happened in a specific visit, including each and every request - literally:
- Page views
- Redirects
- Errors
- Ajax requests
-
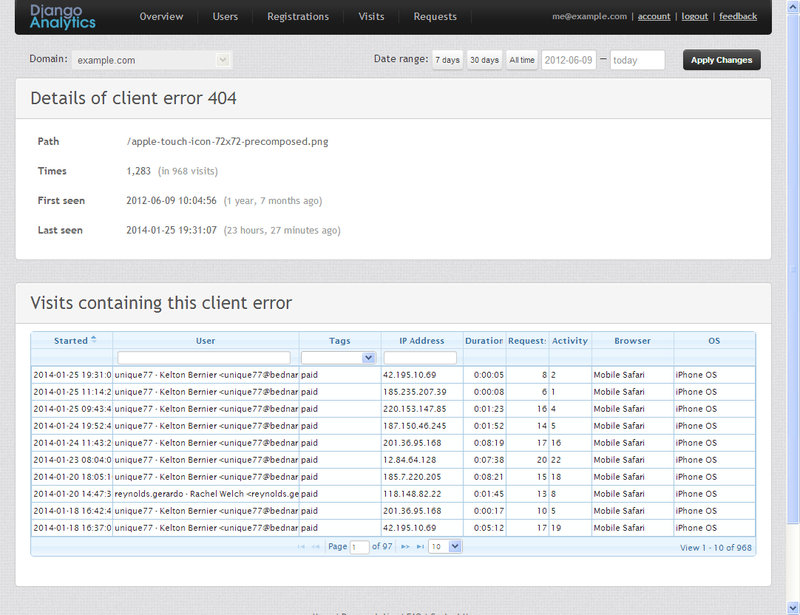
Analyze Errors
Discover the errors that your users encounter – both server errors (5xx) and client errors (4xx). Jump into the specific visits where each error occurred, and see what transpired just before it happened.
-
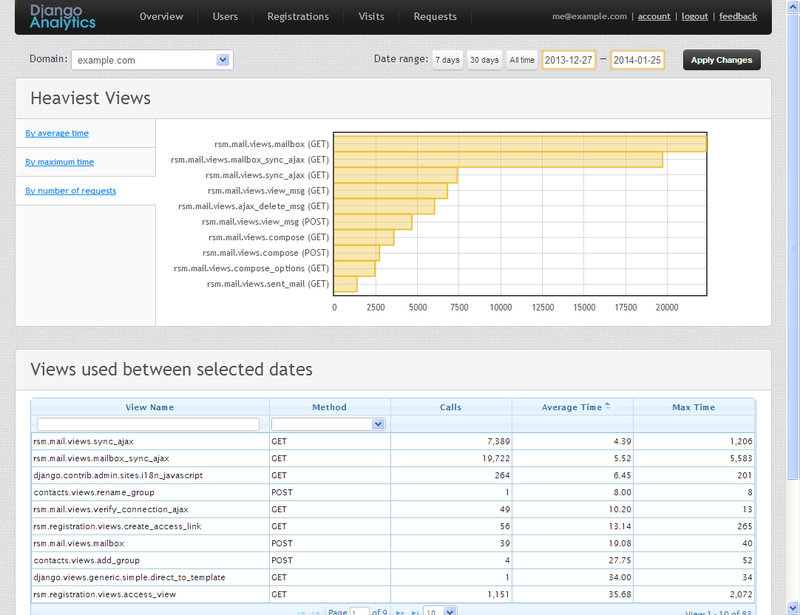
Analyze Performance
Find out which views are the most heavily used, or which ones are the slowest. Then optimize the performance of those that matter.
-
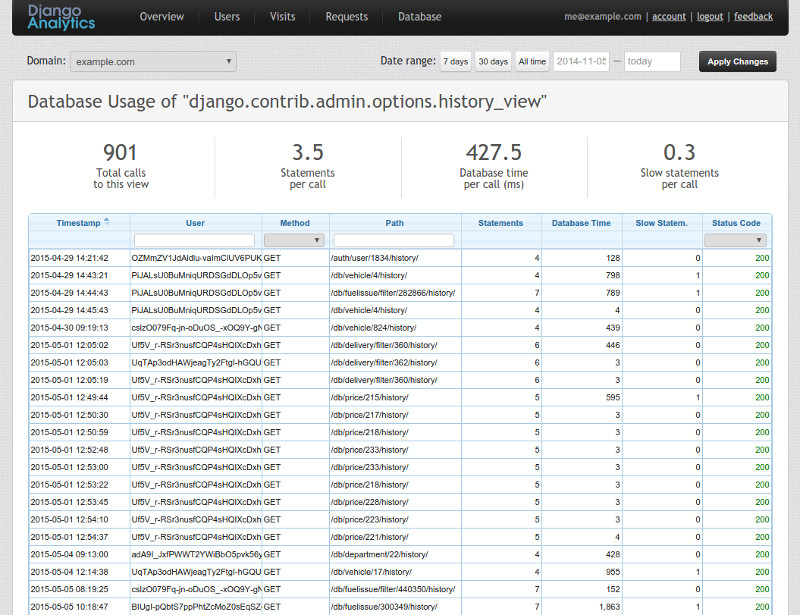
Explore Database Usage
See how many database queries are being used by each view and how long they're taking. Easily identify potential performance issues. Be a hero.
-
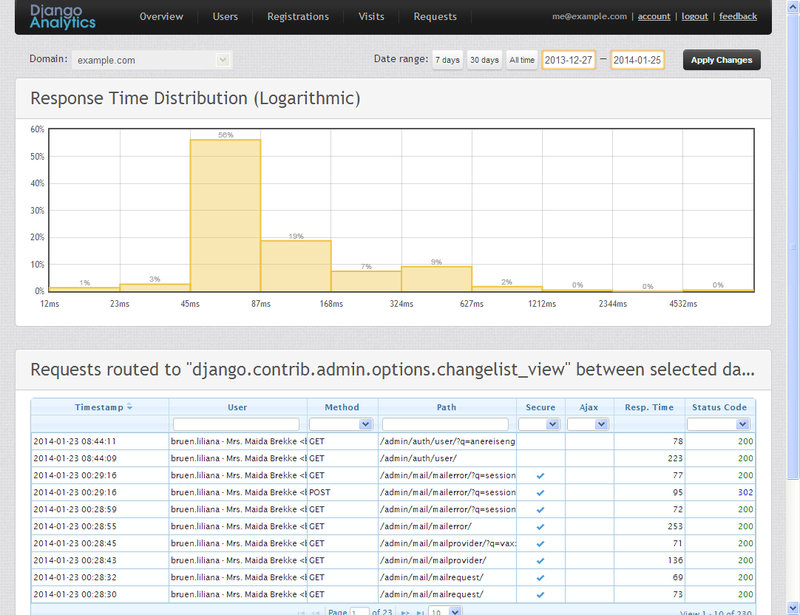
Dig Deeper
Sometimes averages don't tell you the full story. Drill down into a specific view to check how it behaves, and to identify all the requests that it processed.